Create Technical chart of EOD (End of day) and intraday stock price data. Many indicators: Moving Averages, Bollinger Bands, MACD, ADX, RSI, MFI and more than 50 other technical indicators. Ability to create composite indicators by simple drag-drop operation. Point and Figure chart: Create Point and Figure chart with adaptive box sizes. Fibonacci retracements, and Linear Regression channels.
Portfolio and Watchlists so that you can keep eye on investments and opportunities. Alert system: You can set alert based on Trading System and/or price so that you don't miss the investment opportunity. Free data download: More than 50 stock exchange data available for free using built-in feature of downloading free stock price data. So you can start using Stockalyze without subscribing for data. Stockalyze can also read Metastock and ASCII data.
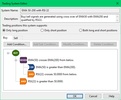
Trading Systems: Stockalyze has many built-in trading systems and you can define your own Trading System using easy to use graphical user interface (GUI). System Tester: Back testing of Trading Systems. Stocks scanner: Use it to scan/explore stocks based on Trading System. Pattern Detection: Stockalyze can detect candlestick, zigzag, double top, and head & shoulders patterns. Annotation: You can add trend-lines, ray, Andrew's Pitch fork, Fibonacci retracements, linear regression, triangle, rectangle, oval, texts, and many other annotation objects on chart.









Comments
There are no opinions about Stockalyze yet. Be the first! Comment